Performance Efficiency Pillar
In information technology systems engineering, design specialists characterize workloads as compute oriented, storage focused, or memory driven, designing solutions tuned to efficiently meet the design requirements. To achieve your performance goals, customers must address how the design of workload components can affect the performance efficiency of the entire application stack.
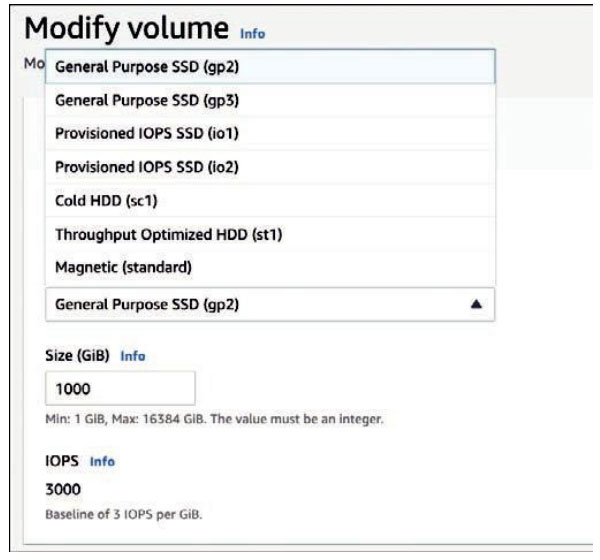
How can you design around a compute bottleneck? How do you get around a limit of the read or write rate of your storage? Operating in the AWS cloud, customers can change compute and network performance as simply as turning off their EC2 instances and resizing the EC2 instance, changing the memory, processor, and net-work specs. Amazon Elastic Block Store (EBS) storage volumes can be changed in size, type, and speed at a moment’s notice, increasing volume size and performance as needs change (see Figure 2-6).

Figure 2-6 Resize EBS Volumes
Maximizing performance efficiency depends on knowing your workload require-ments over time. Measure workload limitations and overall operation by closely monitoring all aspects of the associated cloud services. After several days, weeks, and months of analyzing monitoring data for the computer, networking, and storage services utilized in your application stack, developers and operations teams will be able to make informed decisions about required changes and improvements to the current workload design. Learn where your bottlenecks are by carefully monitoring all aspects of your application stack. Performance efficiency can also be improved with parallelism, scalability, and improved network speeds:
- Parallelism can be designed into many systems so that you can have many instances running simultaneously. Workload transactions can be serialized using SQS caches or database read replicas.
- Scalability in the cloud is typically horizontal. But scale can also be vertical by increasing the size, compute power, or transaction capacity on web, app, or database processing instances or containers. Customers may find success by increasing the sizes of both the compute and networking speeds of database instances without having to rebuild from scratch, if this is a solution that can be carried out relatively quickly.
- Networking is critical to performance engineering in the cloud, because the host architecture that AWS offers its cloud services on, and the EC2 instances and storage arrays used for all workloads, are all networked. Networking speeds across private networks of AWS can reach 200 Gbps. Connecting to the AWS cloud from an on-premises location privately using VPN connections max out at 1.25 Gbps. Utilizing high-speed fiber AWS Direct Connections to the AWS cloud range from 1 to 100 Gbps.
Cost Optimization Pillar
Customers want to optimize their returns on investments in AWS cloud technolo-gies. Successfully reducing cloud costs starts with assessing your true needs. Monitoring is essential to continually improving your performance efficiency, and it’s also the key to unlocking cost benefits over time. AWS provides many cost tools for monitoring costs, including cost estimators, trackers, and machine learning– based advisors. Many of these services are free, such as AWS Cost Explorer or AWS Cost and Usage Report.
When analyzing the daily operation of services such as compute and storage, auto-scaling and true consumption spending are not the default configuration. Insights into spending trends and rates allow you to control what you spend in the cloud.
Sustainability Pillar
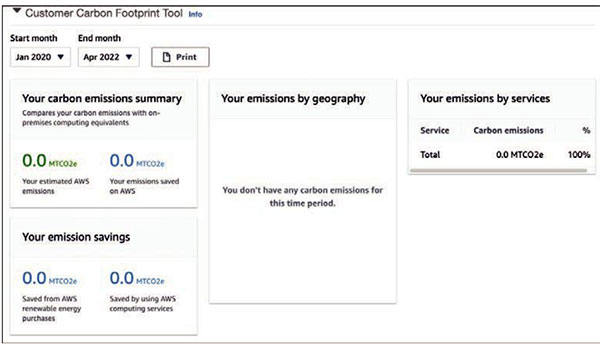
The Sustainability pillar addresses the impact of your workload deployments against long-term environmental issues such as indirect carbon emissions (see Figure 2-7)
or environmental damage caused by cloud services. Because workload resources rely on cloud services that are virtual compute and storage services, areas where improvements in sustainability include energy consumption and workload efficiency in the following areas:
- Utilizing indirect electricity to power workload resources. Consider deploy-ing resources in AWS regions where the grid has a published carbon intensity lower than other AWS regions.
- Optimizing workloads for economical operations. Consider scaling infra-structure matching user demand and ensuring only the minimum number of resources required are deployed.
- Minimizing the total number of storage resources used by each workload.
- Utilizing managed AWS services instead of existing infrastructure.

Figure 2-7 Customer Carbon Footprint Tool
Designing a Workload SLA
Organizations must design workload SLAs that define the level of workload reli-ability they require and are willing to pay for. It should be noted that AWS cloud services are online, very reliable, and up most of the time. The onus is on each AWS customer to design workloads to be able to minimize the effects of any failures of the AWS cloud services used to create application stacks. Note that each cloud ser-vice, such as storage and compute, that is part of your workload application stacks has its own separately defined SLA.
The AWS cloud services that are included in our workloads need to operate at our defined acceptable level of reliability; in the cloud industry this is defined as a service-level objective (SLO) and is measured by a metric called a service-level indicator (SLI). For example, web servers must operate at a target of between 55%
and 65% utilization. By monitoring the CPU utilization of the web servers, you can be alerted using an Amazon CloudWatch metric linked to an event-driven alarm when the utilization exceeds 65%. You could manually add additional web servers, or EC2 Auto Scaling could be used to automatically add and remove additional web servers as required. There are numerous CloudWatch metrics that can be utilized for more than 70 AWS cloud services providing specific operational details and alert when issues occur.
Ongoing CloudWatch monitoring should be used to monitor each integrated cloud service for calculating the reliability of the workload as a whole using the cloud service metrics (see Figure 2-8). Each metric can be monitored over a defined time period, which can range from seconds to weeks; the default time period is typically 5 minutes. Every month the average amount of workload availability can be calculated by dividing the successful responses against all requests. By monitoring all inte-grated cloud services of a workload, valuable knowledge will be gathered regarding reliability issues, potential security threats, and workload performance.

Figure 2-8 CloudWatch Metrics
Service-level indicators are invaluable for all cloud services; here are a few examples to consider:
- Availability: The amount of time that the service is available and usable
- Latency: How quickly requests can be fulfilled
- Throughput: How much data is being processed; input/output operations per second (IOPS)
- Durability: The likelihood data written to storage can be retrieved in the future